Grid data the way operators see it.
Live demand, queues, wholesale prices, and curtailment in one place. Sourced from public ISO and EIA feeds. Free to use, code on GitHub.
Open tools for open problems.
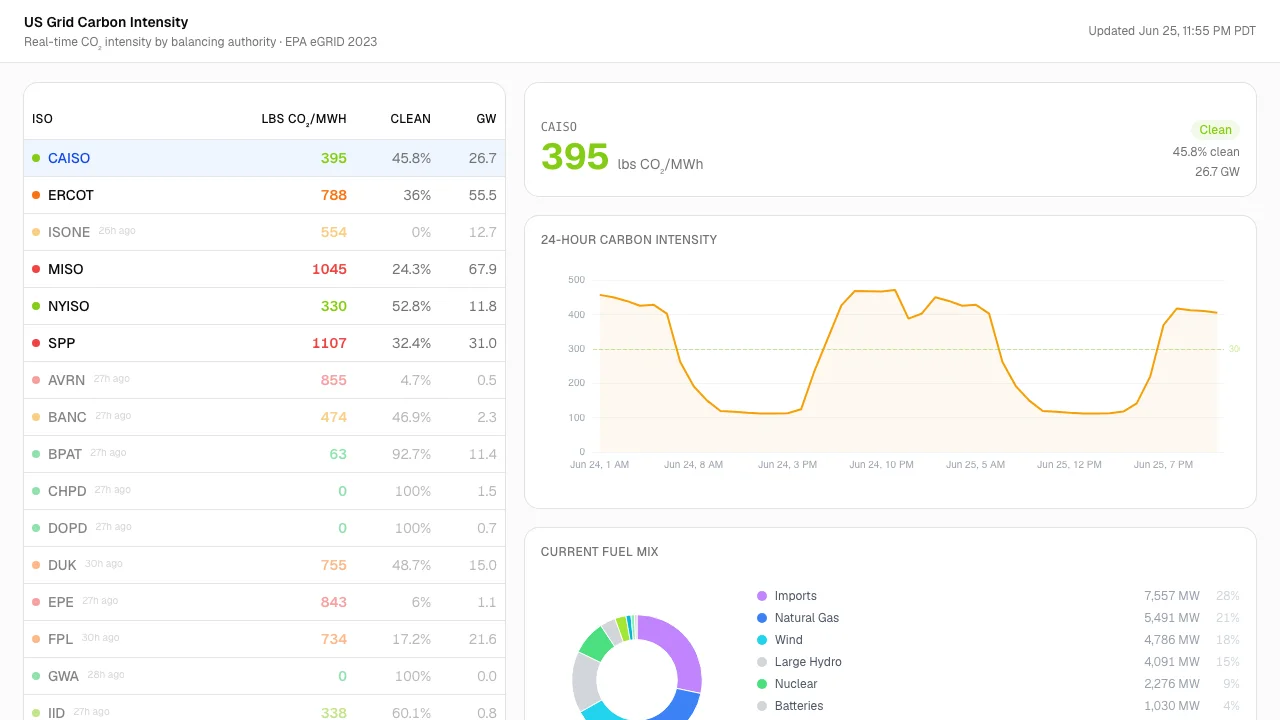
Real-time CO₂ intensity across every US grid region.
Weighted average lbs CO₂/MWh from live fuel mix data. Covers all 7 primary ISOs (CAISO, ERCOT, MISO, PJM, NYISO, ISONE, SPP) plus 20+ smaller balancing authorities via EIA-930. EPA eGRID 2023 emission factors. 60-second polling.
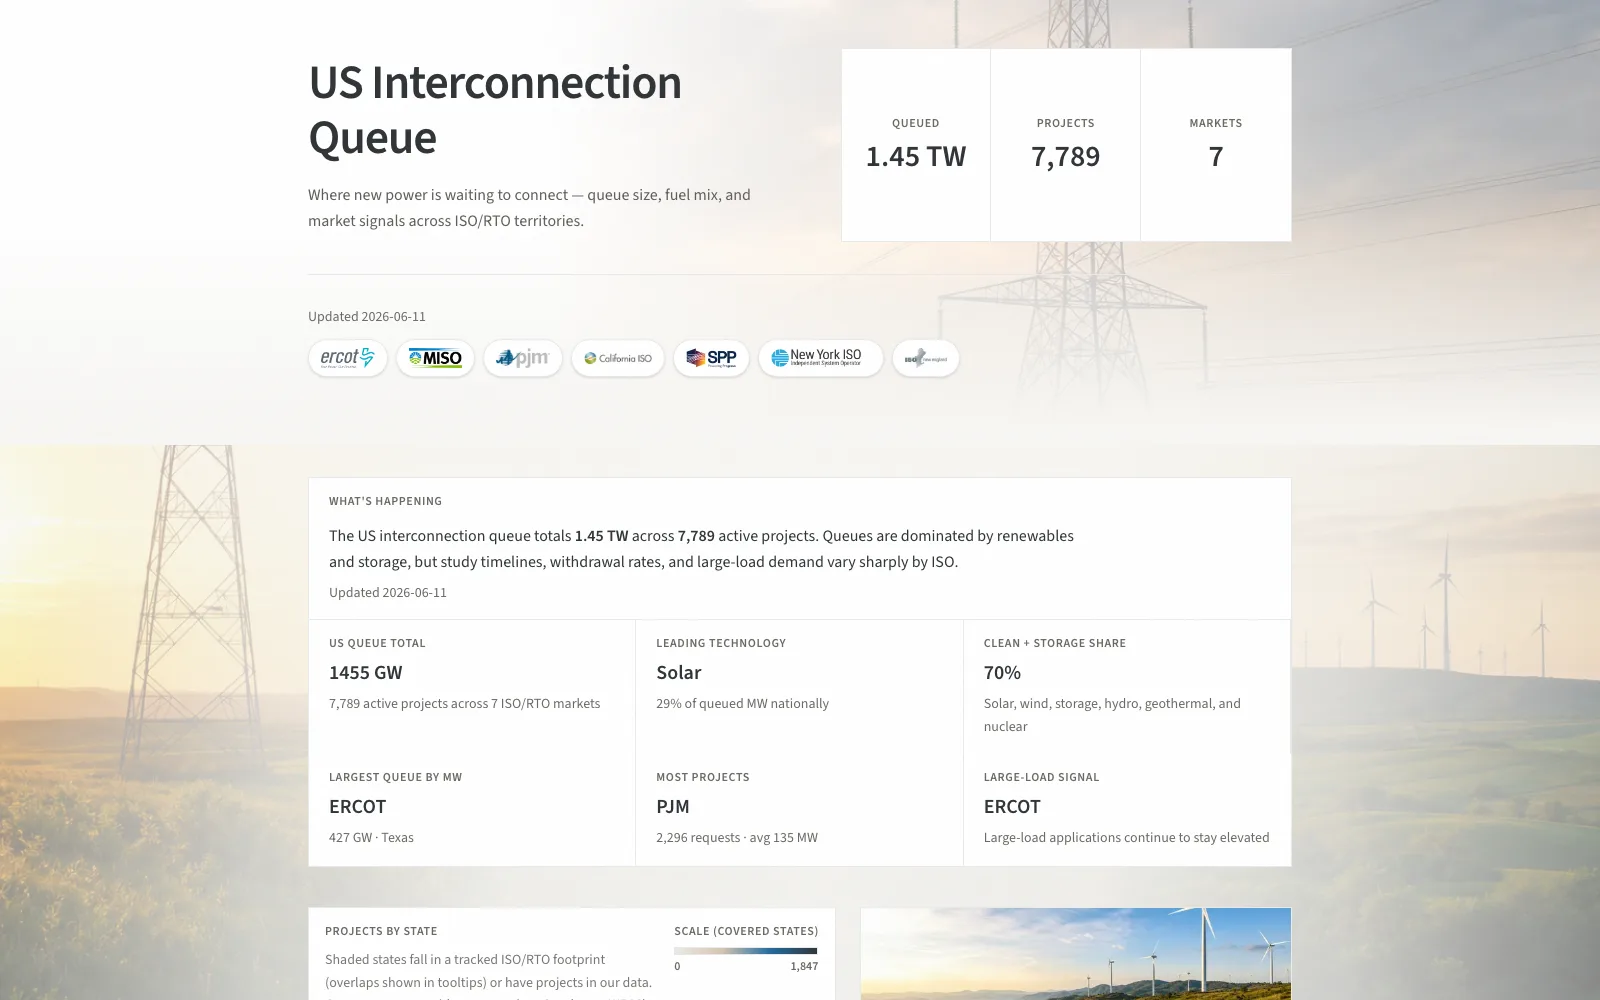
Current Observation of Interconnection Projects across 7 ISOs.
Unified search across ERCOT, MISO, PJM, CAISO, SPP, NYISO, and ISO-NE. Request ID is ISO-native (INR at ERCOT). GIS Film is ERCOT-only. Daily refresh.
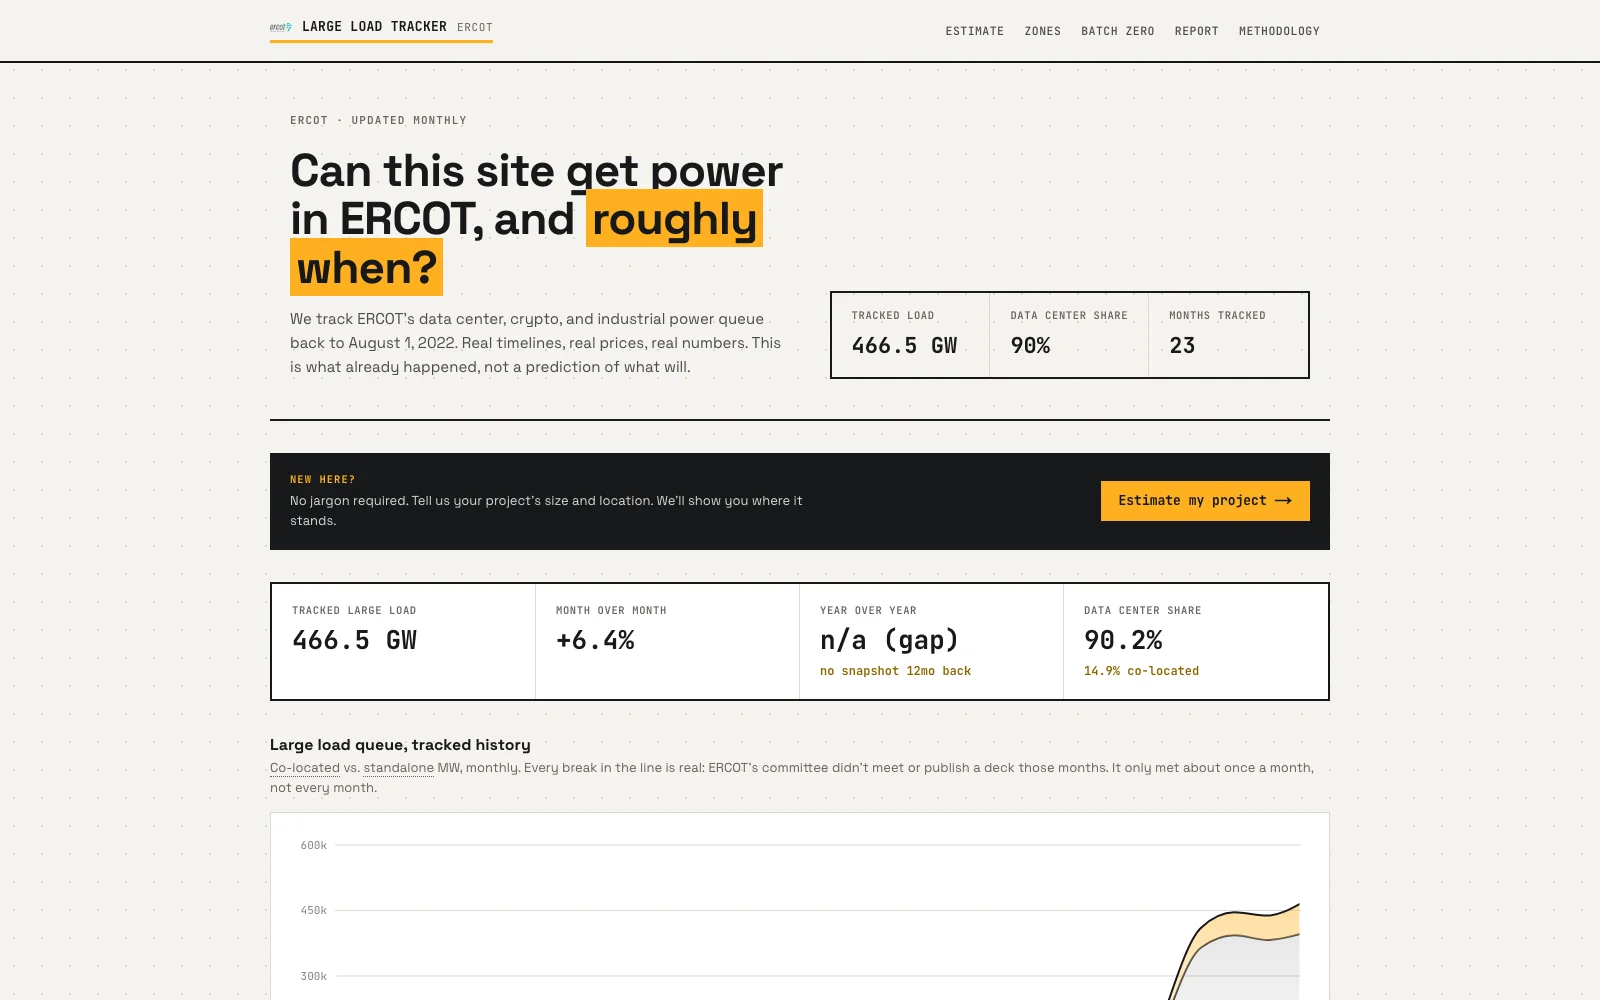
How much Large Load is in the ERCOT queue, and what the decks actually show.
ERCOT Large-Load Queue history from LLWG/LFLTF Filing Observations. Zone Scorecards carry a Mark, not a Clearance Band. Line Ahead is arithmetic, not a forecast. Batch Zero is the first Large-Load Integration instance.
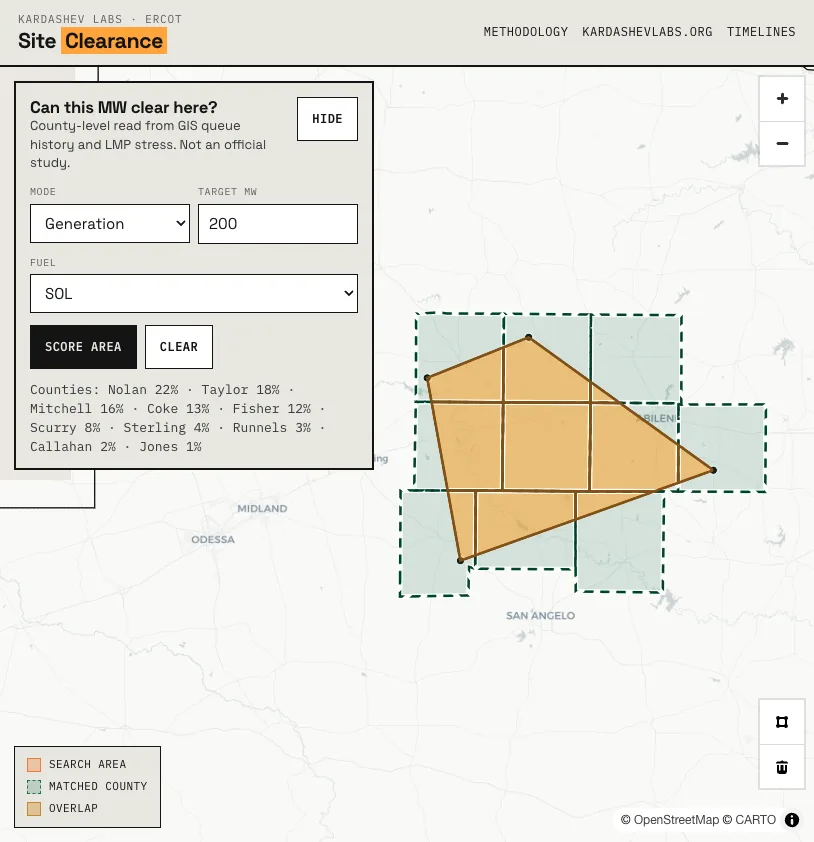
Draw a Footprint. See the Clearance Band for that MW.
County-level ERCOT Clearance Band from public GIS Film, measured Full Process, and Settlement Zone stress. Strong / mixed / weak with the drivers shown. Not an official study.
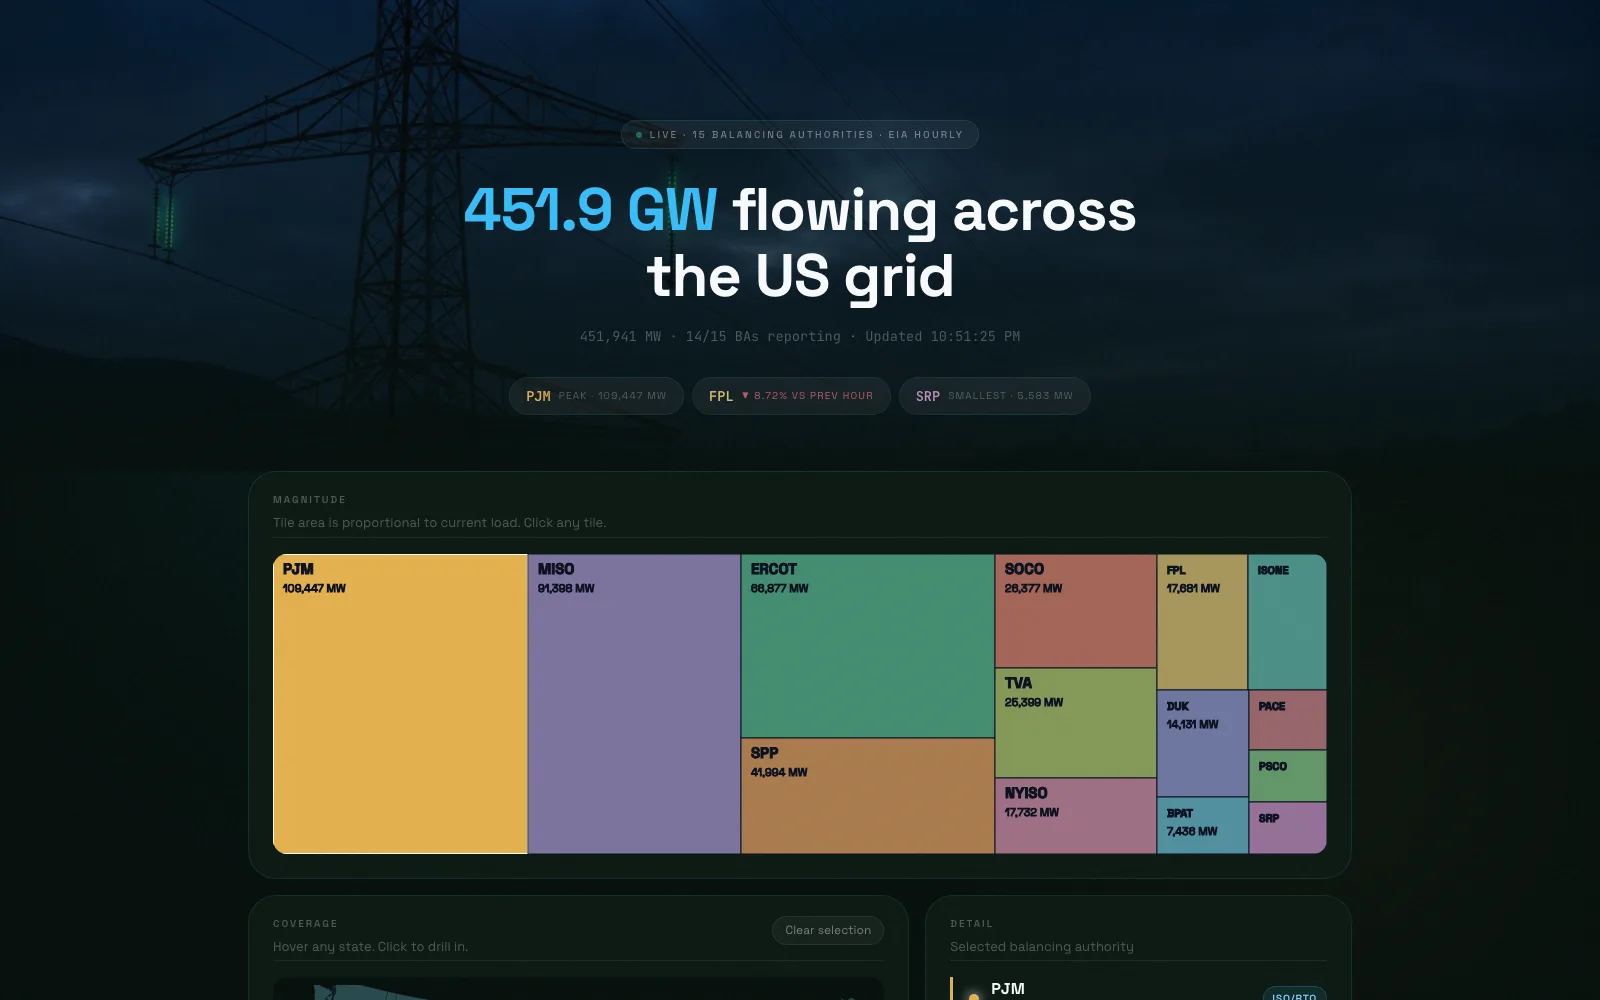
Real-time US electricity demand across 15 balancing authorities.
Hourly demand from EIA across 15 balancing authorities (~95% of CONUS). Map, treemap, and recent trends in one view.
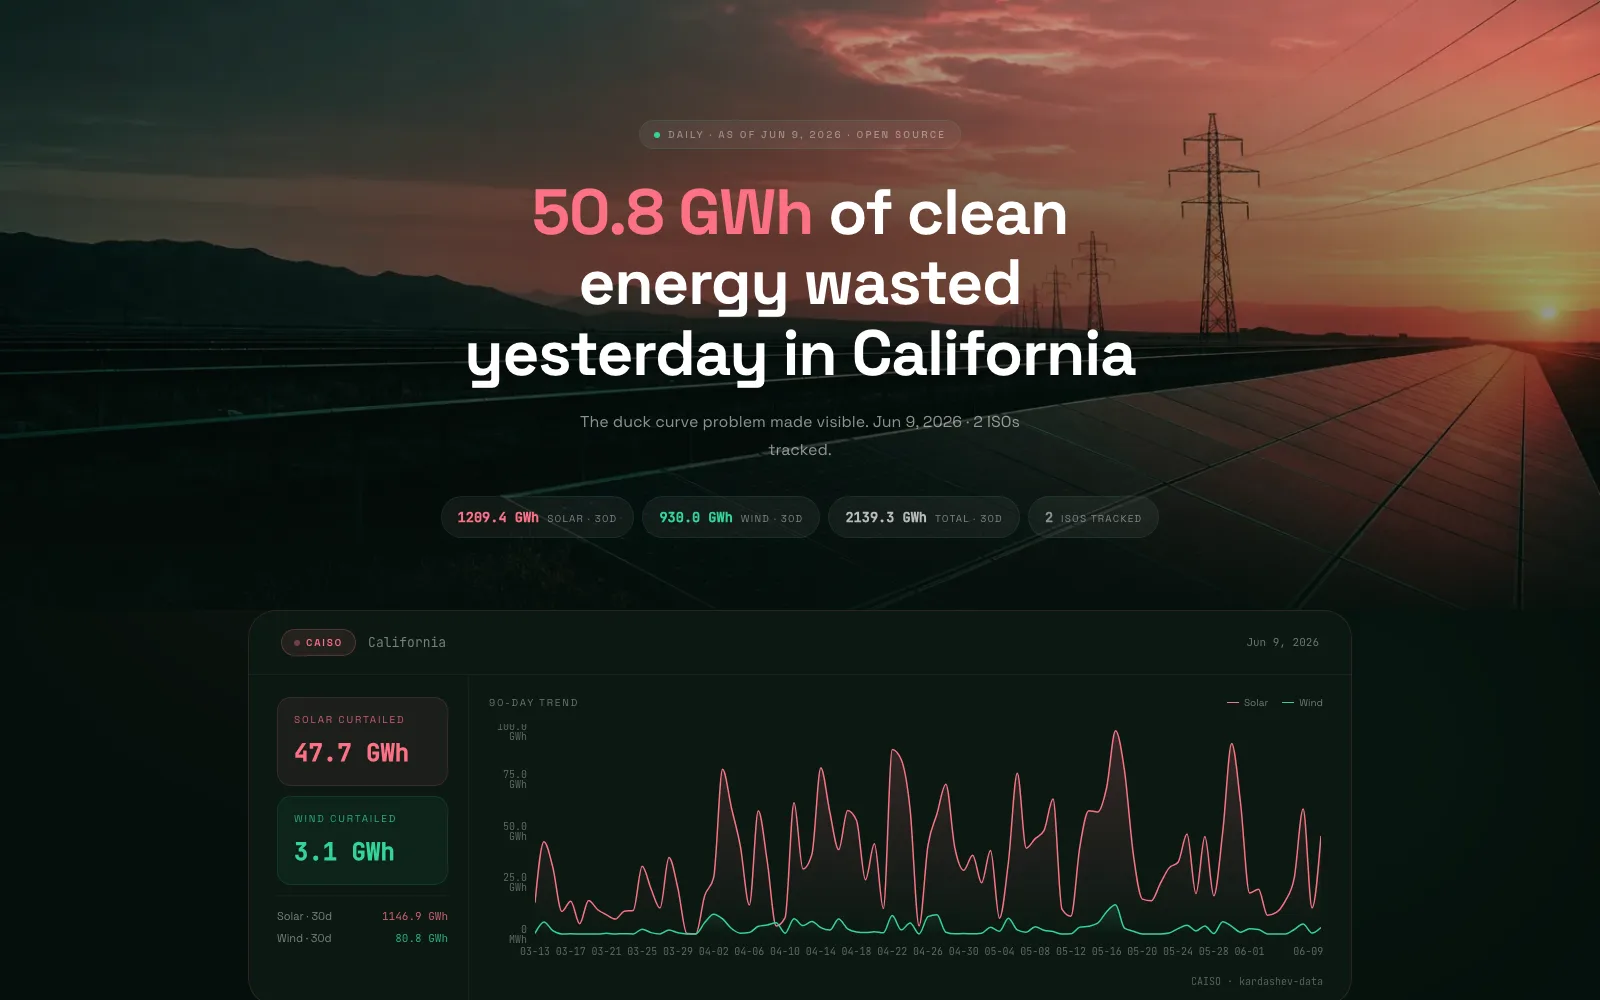
Daily solar and wind curtailment, by ISO.
CAISO, SPP, and ERCOT. 90-day history. Useful when you want the actual curtailed MWh, not another duck-curve essay.
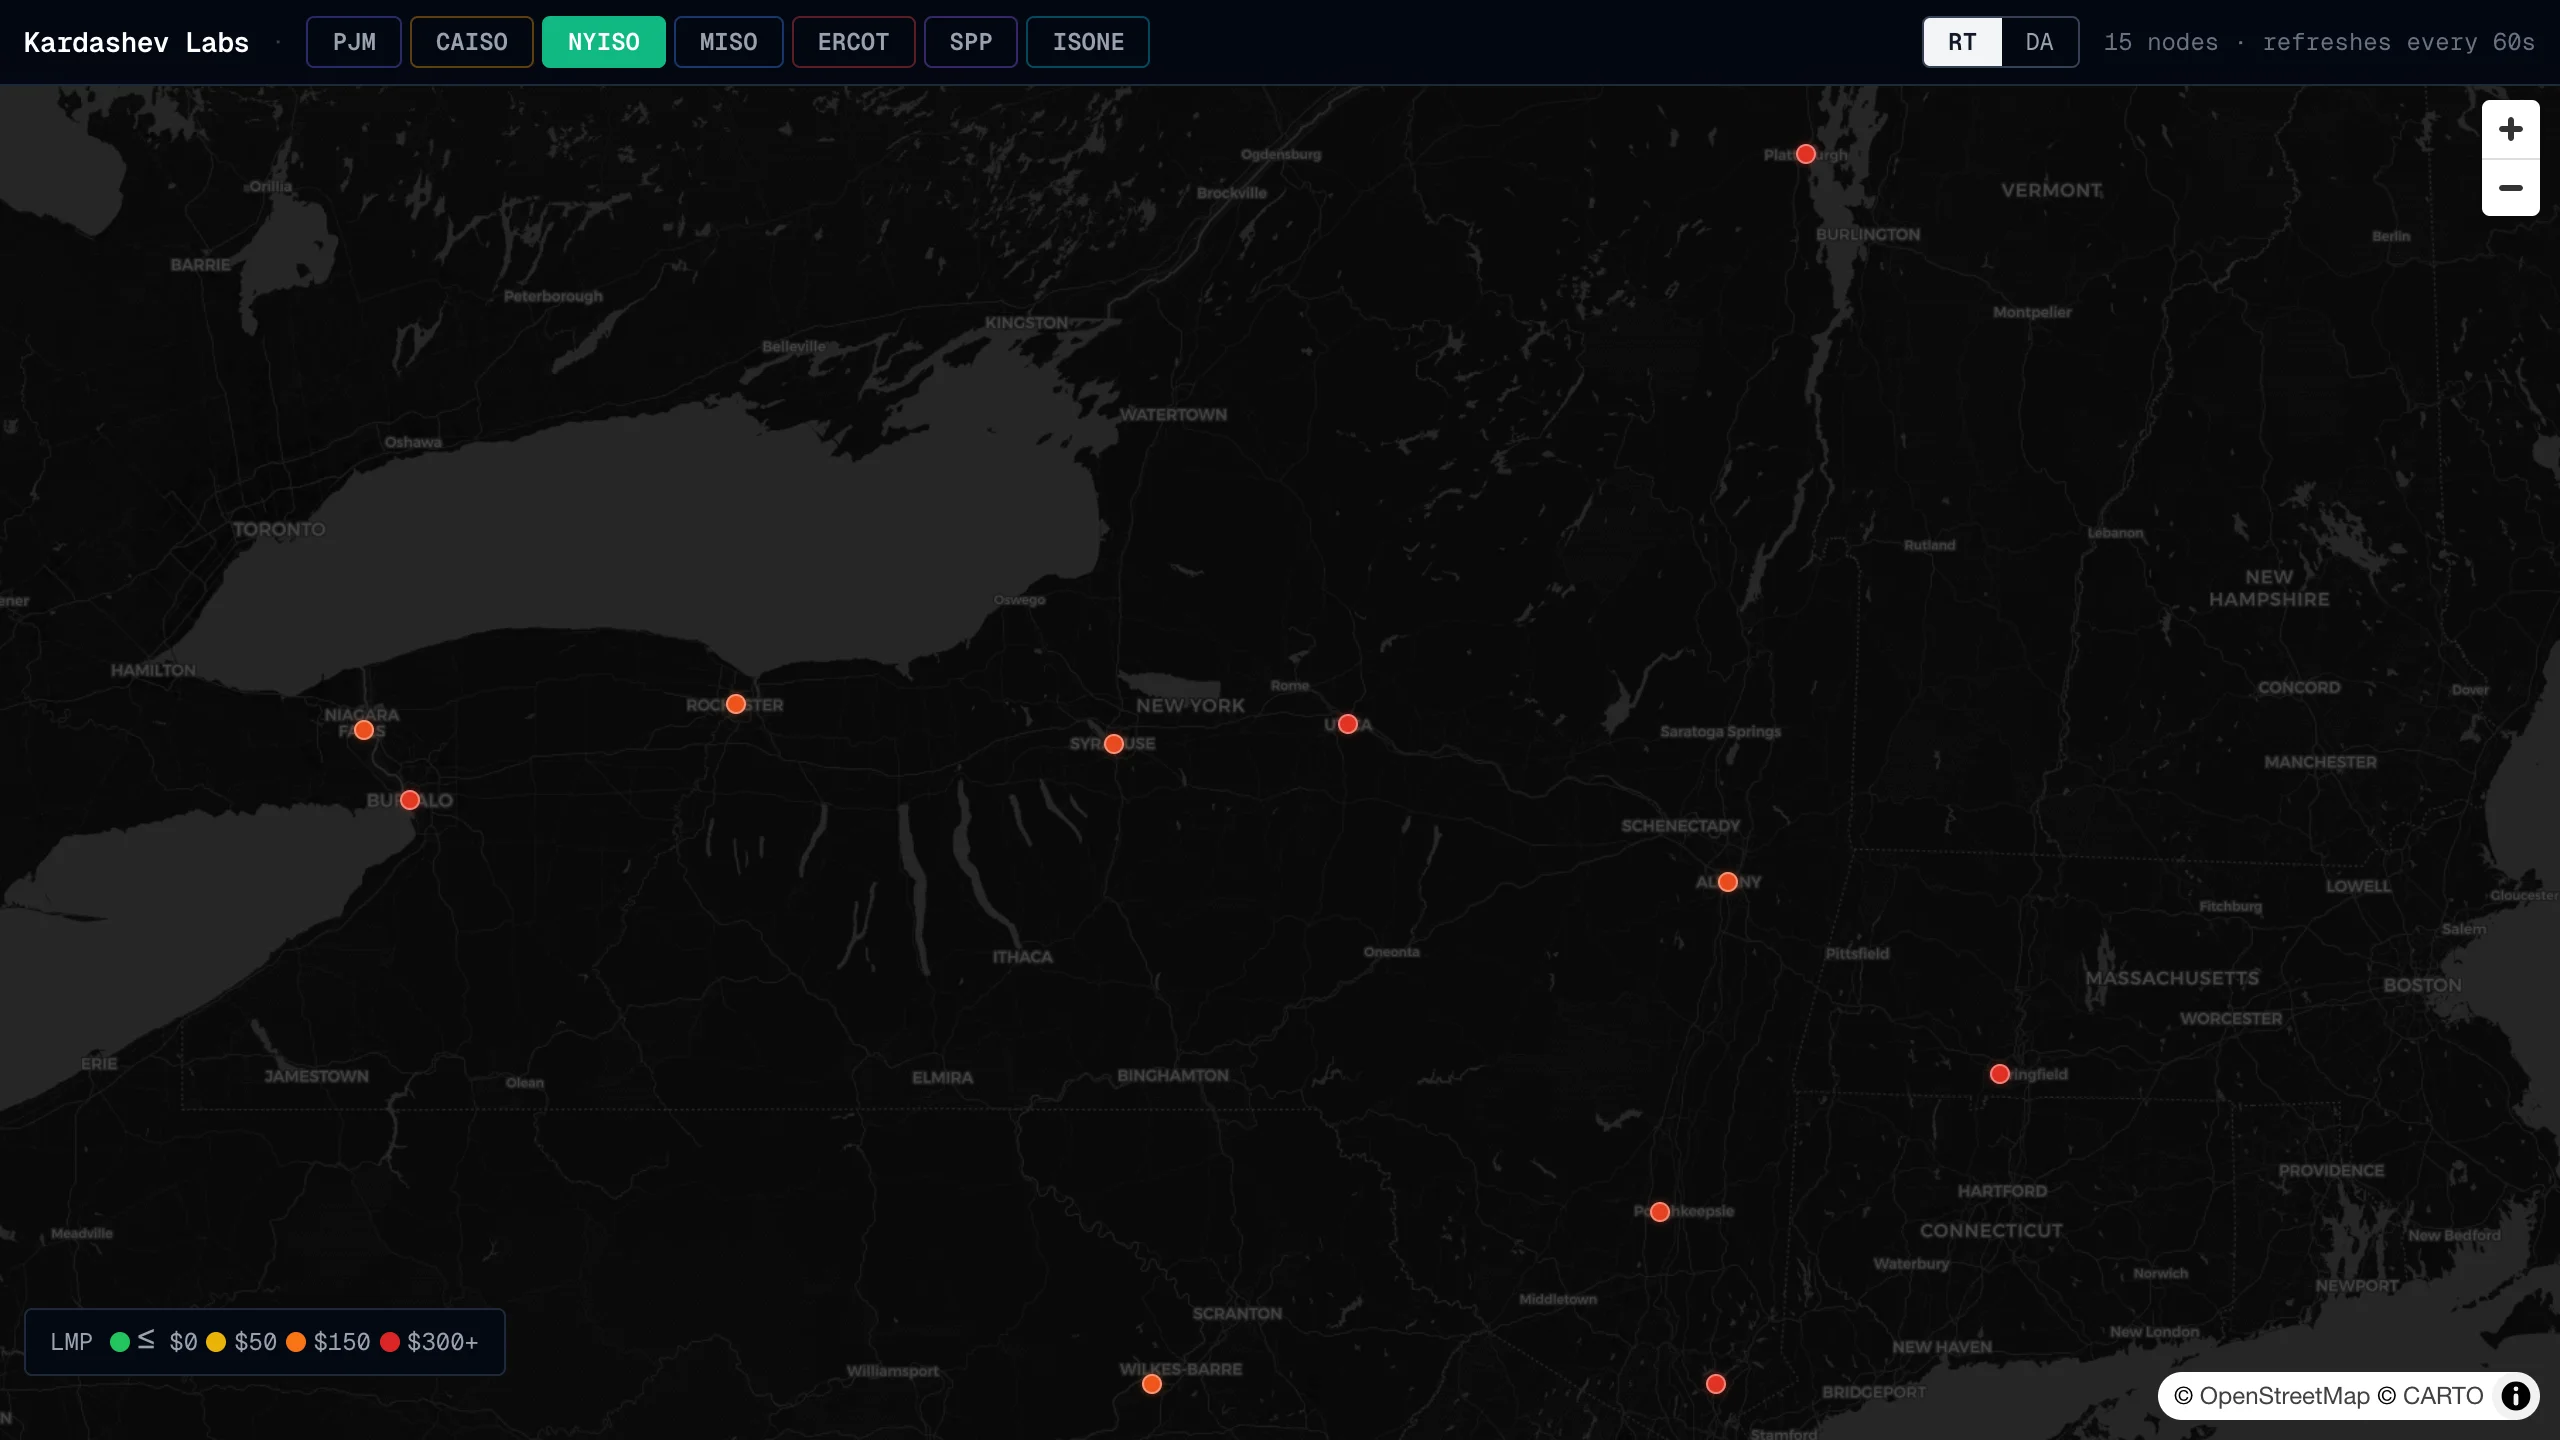
Live electricity prices on a map. Every pricing node, every ISO.
Full-screen nodal price map across NYISO, ERCOT, MISO, SPP, and CAISO. Every node color-coded from green to red by real-time LMP. Click any node for 14-day history: energy, congestion, and loss breakdown. RT and DA markets. Auto-refreshes every 60 seconds.
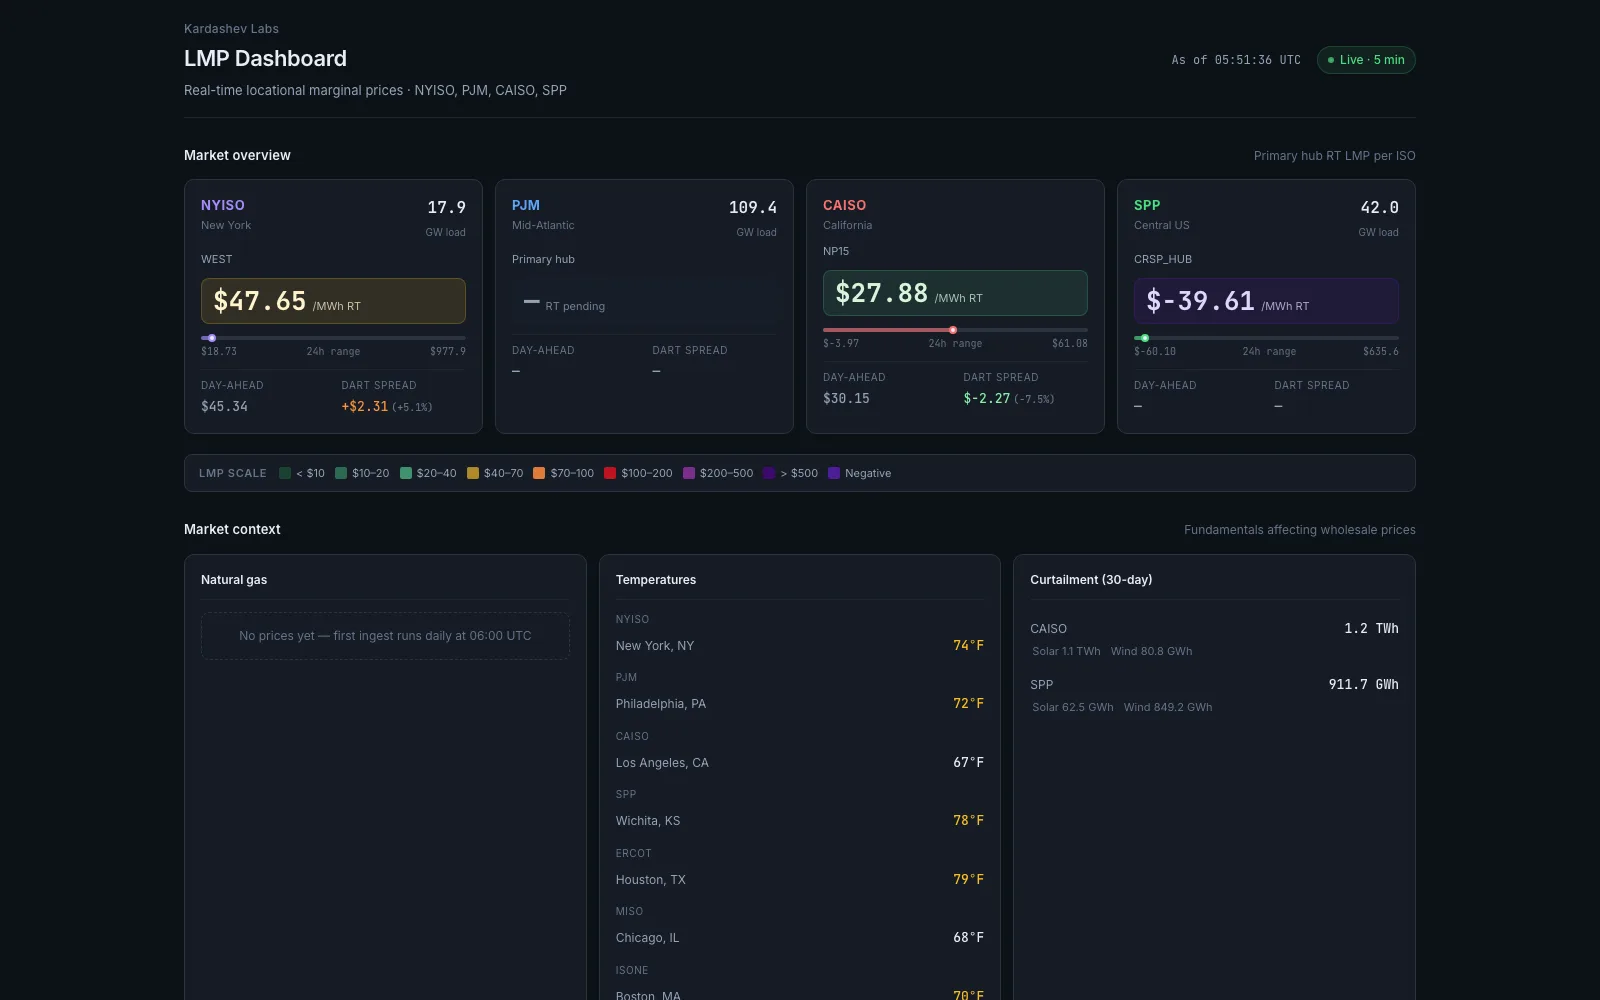
Electricity spot prices across the US grid. Every 5 minutes.
Real-time and day-ahead locational marginal prices across NYISO, PJM, CAISO, and SPP. Energy, congestion, and loss components per hub node. Fuel mix by source, Henry Hub gas prices, grid temperatures, renewable curtailment, and battery storage, all in one terminal.
Each Forecast Model calls the spread. See if it was right.
A temporal fusion transformer posts day-ahead RT minus DA Spread Issuances for 15 ERCOT hubs and Settlement Zones before delivery. A Spread Issuance is never revised after Issue Time. After settlement we score them in public, including a Paper DART Rule with fees.
Open source on GitHub
Source code, data pipelines, and infrastructure, all public under kardashev-lab.
Stop tabbing through seven ISO portals.
The data is already public. It just sits in different formats, behind different logins, refreshed on different clocks. We pull what we can into free tools you can query today: queues, prices, demand, curtailment, and a forecast we score in public. We only automate when the numbers hold up.

“If we can't explain it, we don't deploy it.”
Plan, prove, then scale.

Plan
Write the schedule and the assumptions down first. Advisory mode before anything auto-dispatches.
Prove
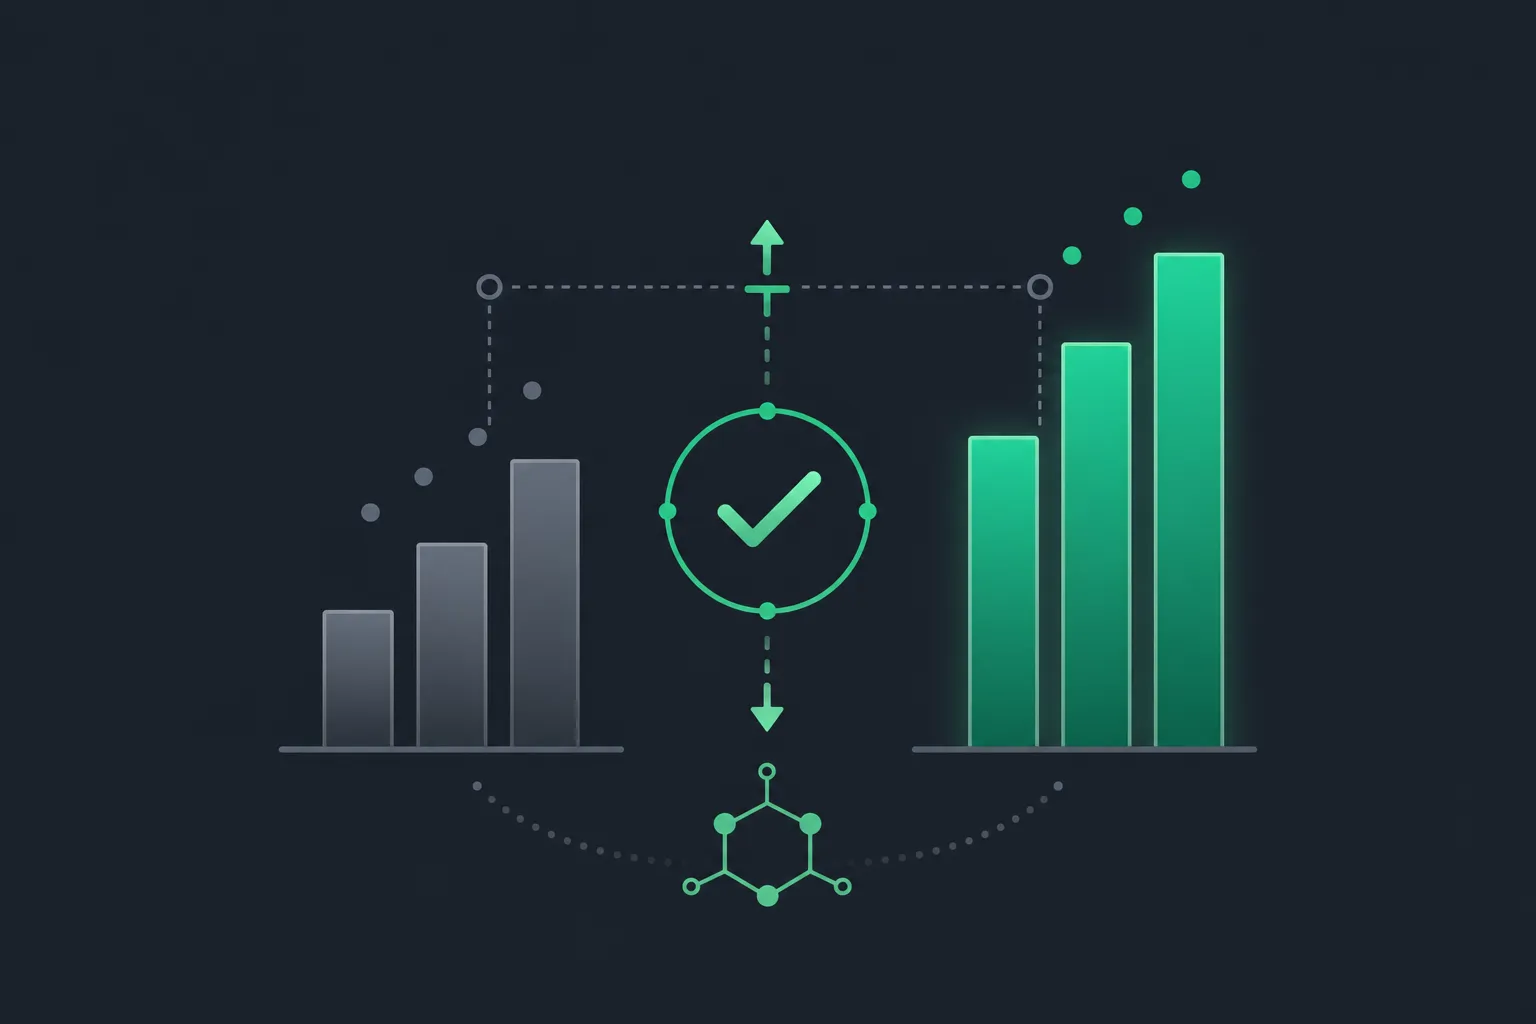
Keep a baseline. Measure the delta. If we cannot explain the number, it does not ship.

Scale
Automate the parts the data already supports. Leave the rest alone until it does.
Stay close to the work.
Occasional notes on what we are building and what the data shows. Unsubscribe anytime.