Notes from the grid.
Essays from measured ISO records: queues, curtailment, prices, and the operating regimes around them. Written from the tools, not as product pitches.
 Methods··4 min
LBNL's ERCOT queue data has real gaps. Here's how many our filing history can close.
LBNL's Queued Up is the standard reference dataset for US interconnection queues. Cross-referenced against our own ERCOT GIS filing history, some of its ERCOT gaps are fillable, some aren't, and one class of value shouldn't be trusted at all.
Read the essay →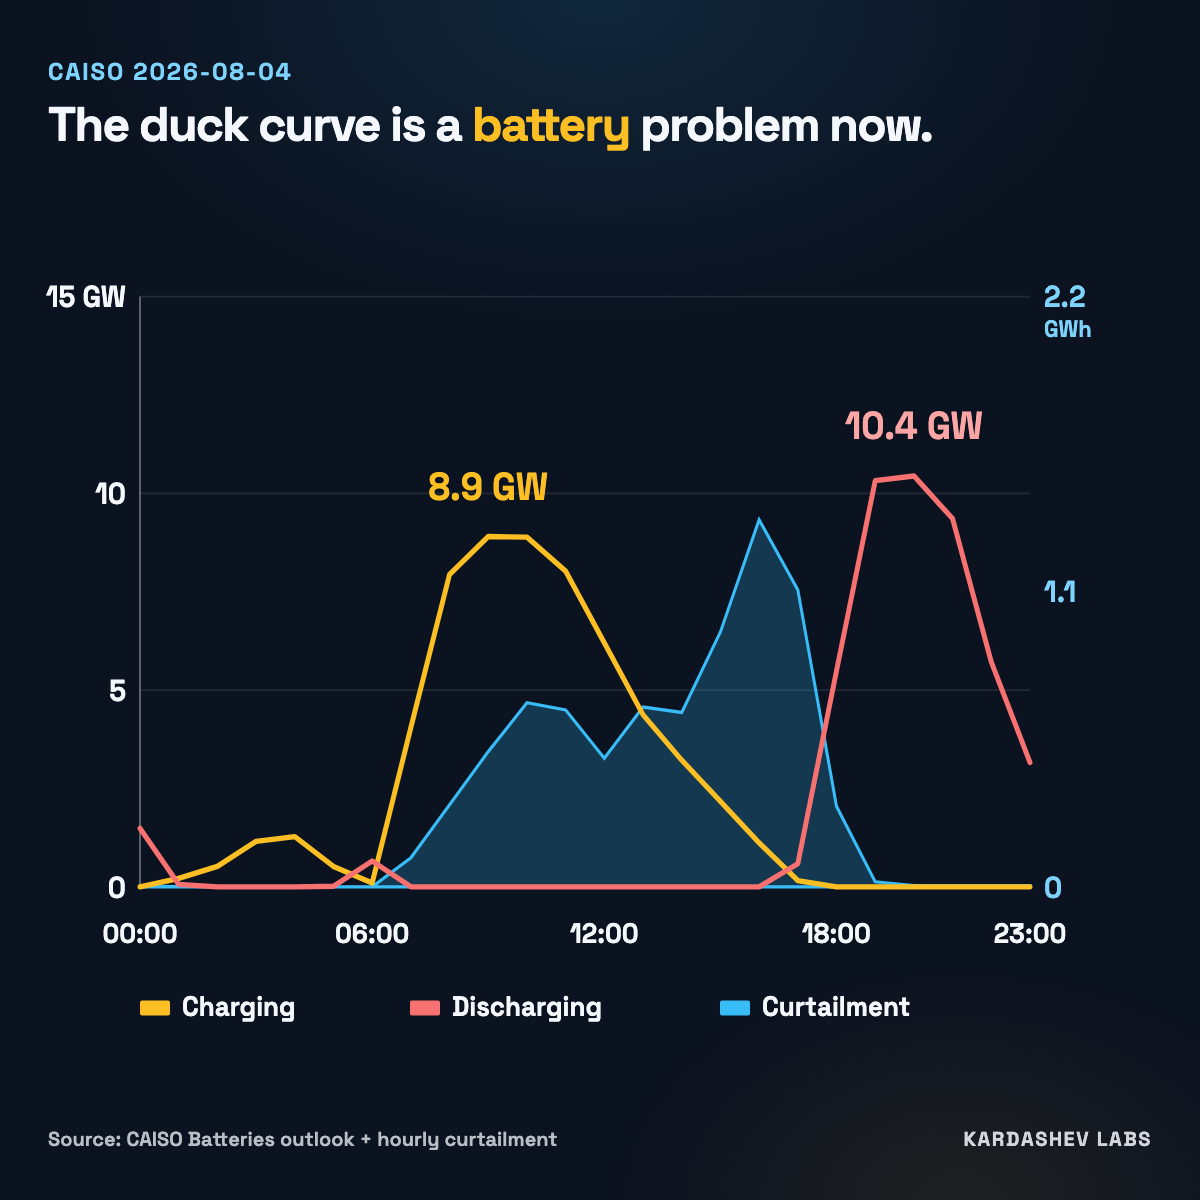 Curtailment··3 min
The CAISO duck curve is a battery problem now.
On 2026-08-04, CAISO batteries charged about 8.9 GW near mid-morning while solar was still curtailed, then discharged 10.4 GW into the evening ramp. Same-day curtailment: 7.8 GWh.
Read the essay →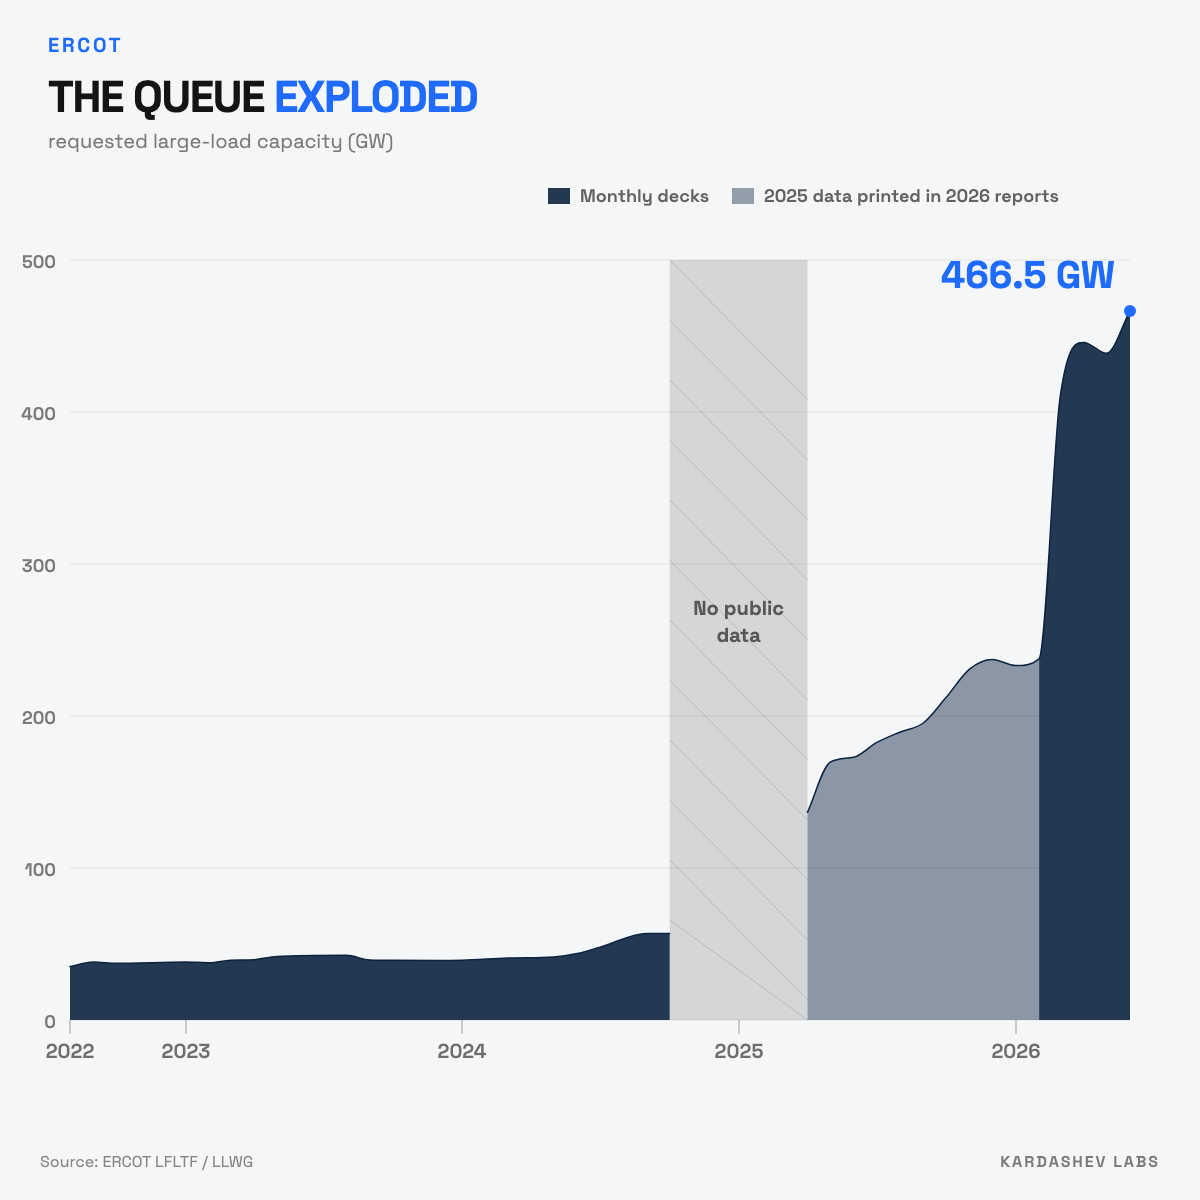 Queues··3 min
The ERCOT large-load queue was climbing before 2026.
Requested Large-Load capacity sat near 35–57 GW for years, then climbed through 2025 and hit 466.5 GW by June 2026. Observed Energized MW is still basically the x-axis.
Read the essay →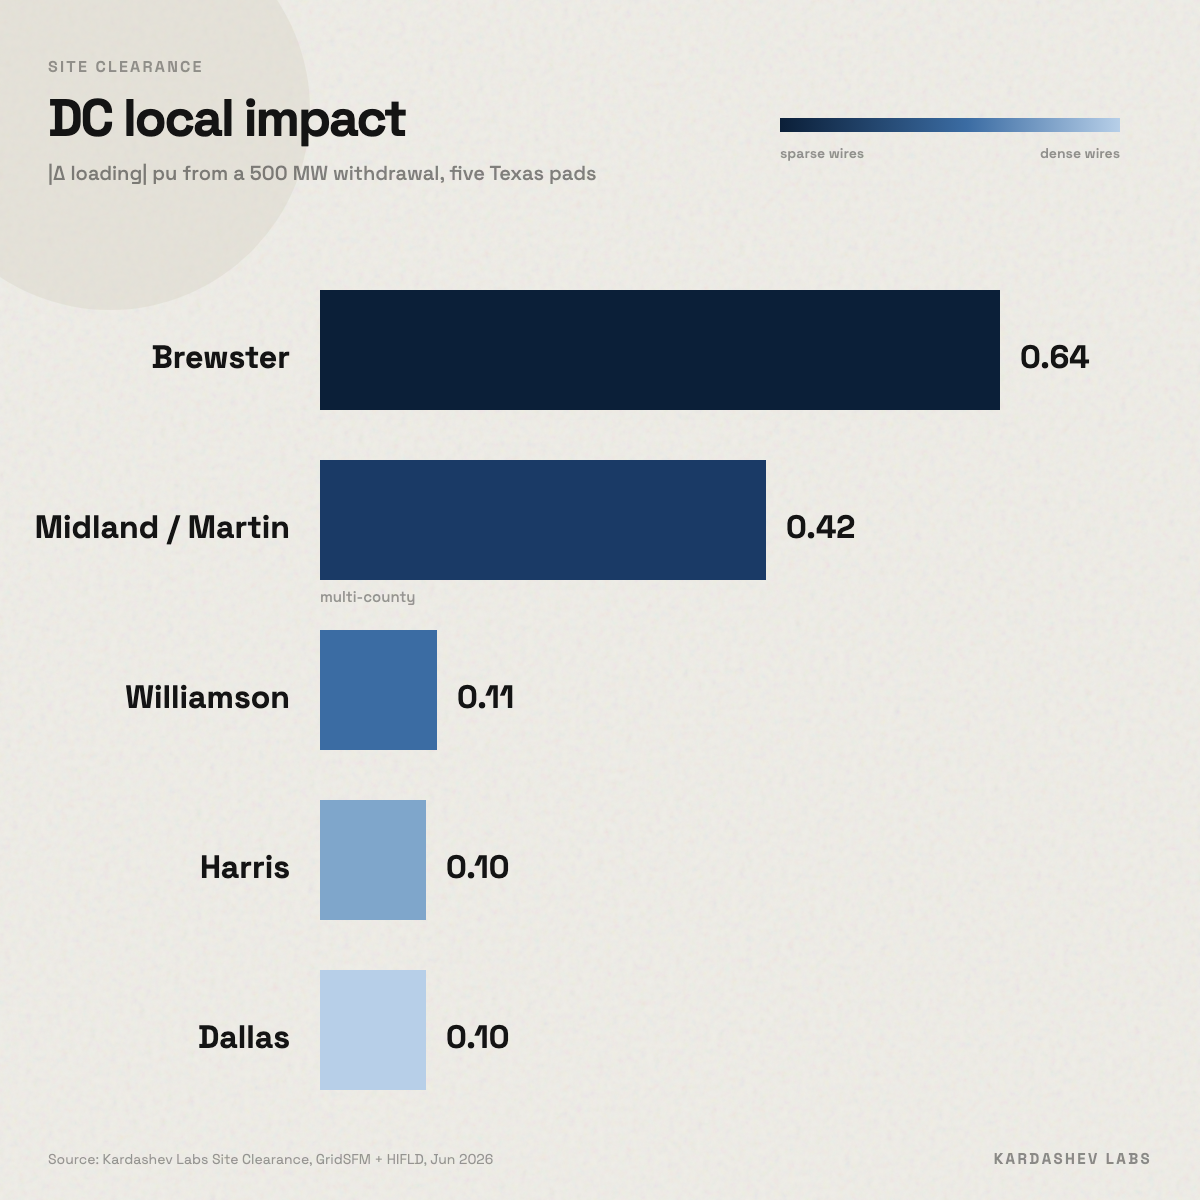 Methods··4 min
Where can a 500 MW load get power in ERCOT?
Five Texas footprints run through Site Clearance at 500 MW large load: gen queue, zone peer timelines, LMP stress, HIFLD density, GridSFM DC screen. Public data. Not an ERCOT study.
Read the essay →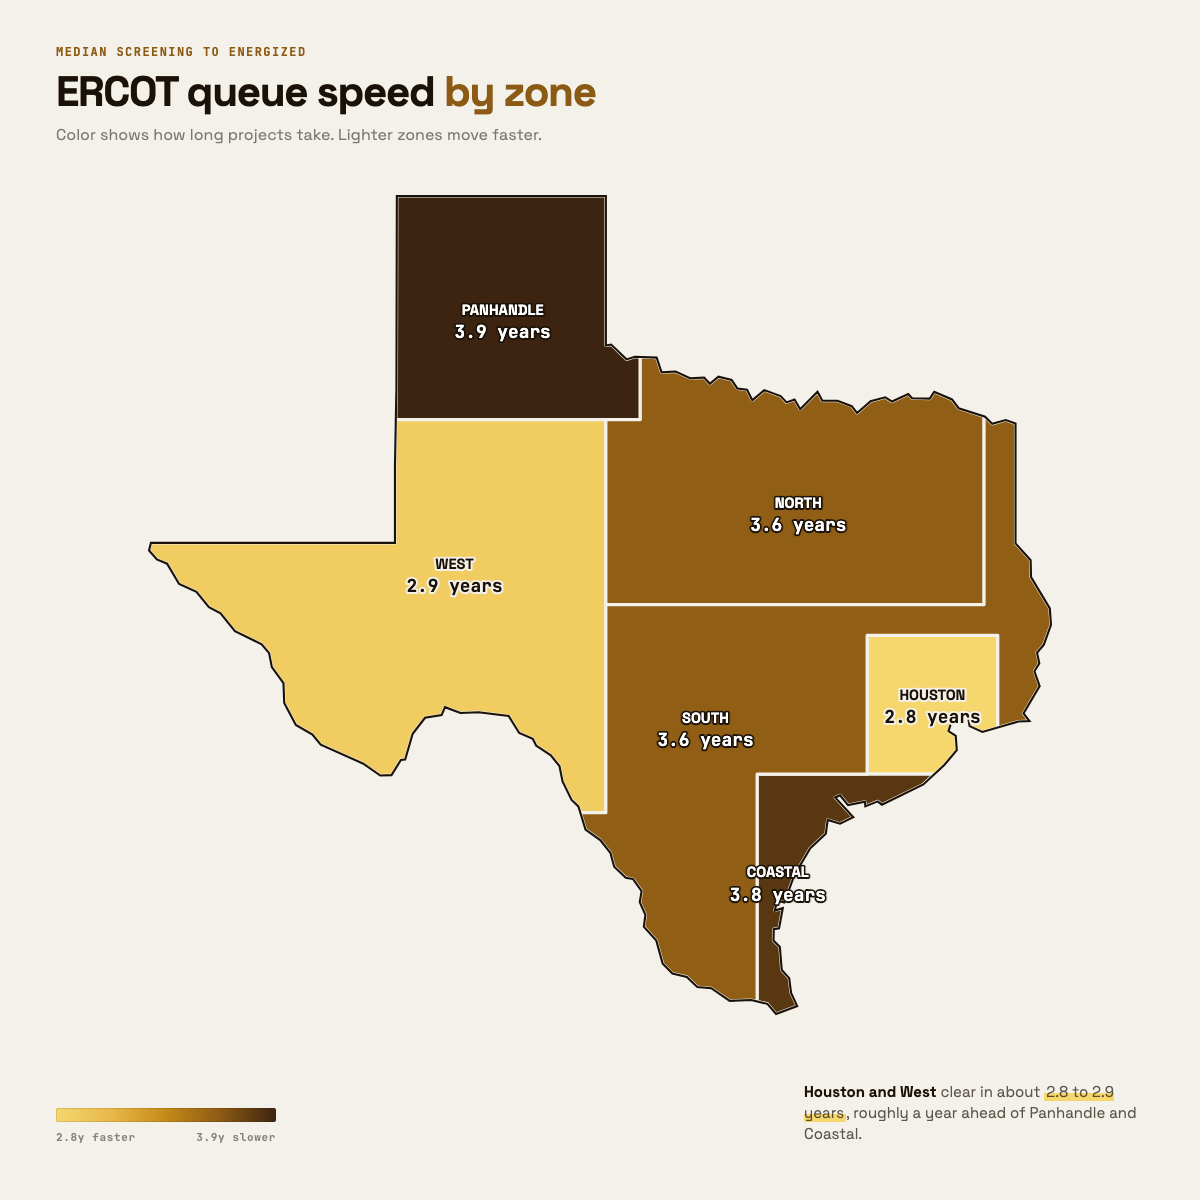 Queues··3 min
ERCOT Full Process is not one number.
People quote one ERCOT interconnection timeline like it applies everywhere. Measured Full Process from 97 months of GIS Film shows CDR Zone and fuel gaps of nearly a year.
Read the essay →