The CAISO duck curve is a battery problem now.
On 2026-08-04, CAISO batteries charged about 8.9 GW near mid-morning while solar was still curtailed, then discharged 10.4 GW into the evening ramp. Same-day curtailment: 7.8 GWh.
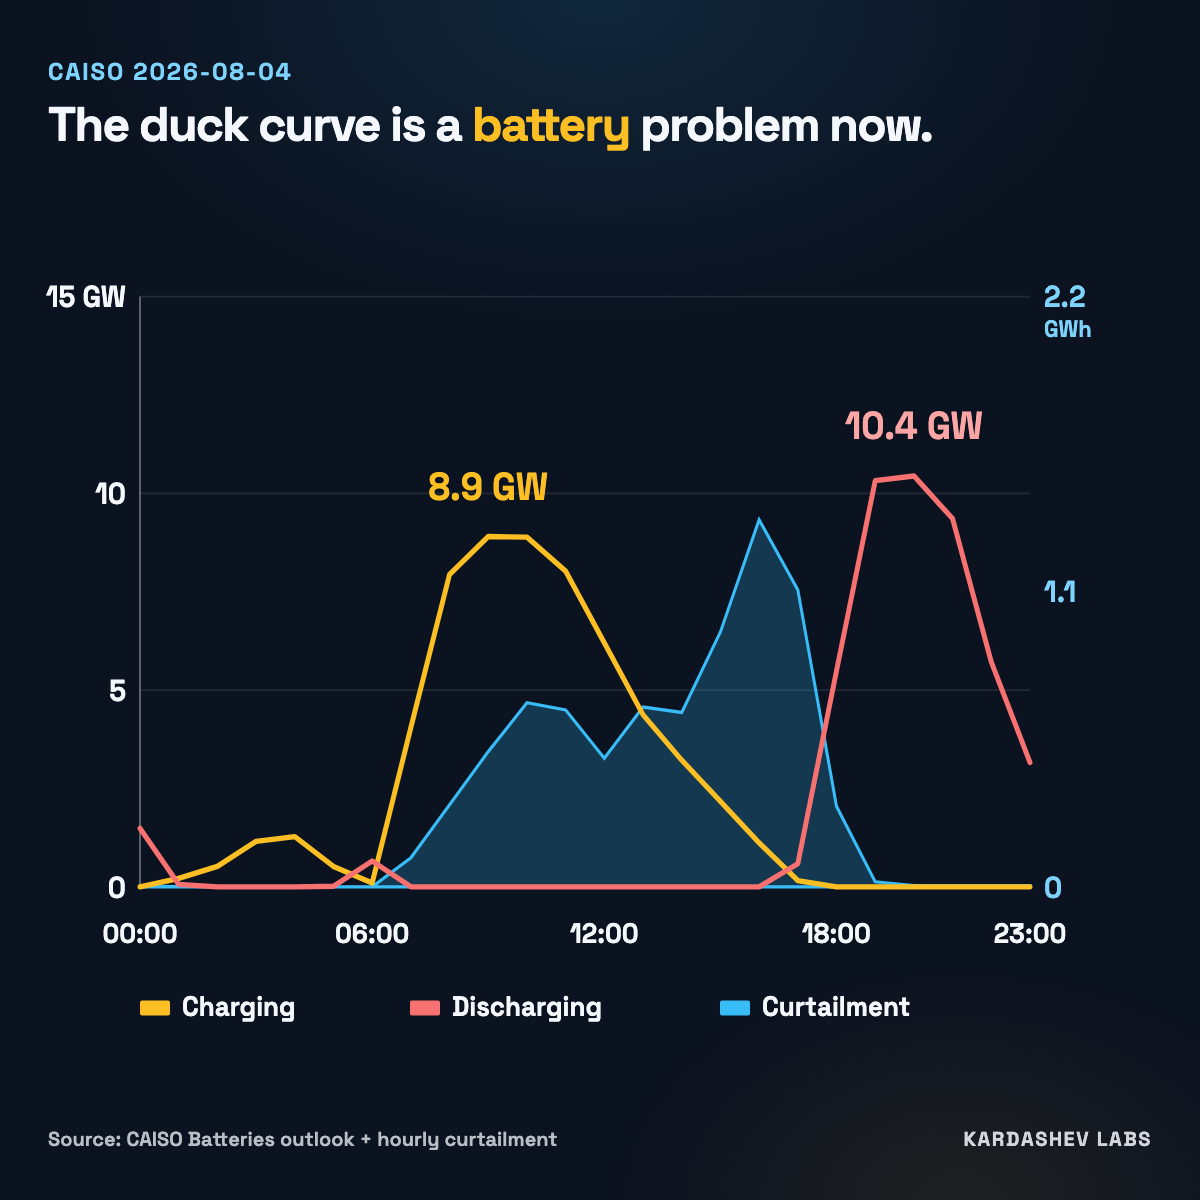
The duck curve used to mean one thing: midday solar floods the grid, evening net load spikes, operators scramble. That cartoon is incomplete in California today.
The missing piece sits in CAISO's own outlook feed. The battery fleet charges while the sun is up, discharges into the evening ramp, and still shares the day with curtailment. The shape problem did not vanish. It got a dispatch handle.
One day on the same clock
2026-08-04 (Pacific). Two measured streams from CAISO primary publications, aligned hour by hour:
- Hourly solar and wind curtailment from CAISO's daily renewable report
- Fleet battery charging and discharging from CAISO
fuelsource.csvBatteries (5-minute outlook)
| Moment (PT) | Fleet | Curtailment |
|---|---|---|
| ~09:00 | Charge peak 8.9 GW | Still dumping solar (~0.5 GWh that hour) |
| 10:00 to 15:00 | Multi-GW charging | 4.1 GWh curtailed in the window |
| ~20:00 | Discharge peak 10.4 GW | Curtailment already near zero |
| Full day | Charge midday, discharge evening | 7.8 GWh total solar+wind curtailed |
Same calendar day. Batteries were the midday sink and the evening source, at gigawatt scale, while curtailment still ran.
The pattern holds through the week
Across 2026-08-01 through 2026-08-06, every day in CAISO's historical fuelsource.csv showed the same flip:
- Midday charge peaks around 8.9 to 10.4 GW (hourly means)
- Evening discharge peaks around 10.4 to 12.3 GW
- Daily curtailment on 2026-08-04 still 7.8 GWh (week-wide curtailment pattern separately confirmed from CAISO daily renewable reports)
July 31 had an 11.8 GW evening discharge peak (hourly mean) in the same fuelsource film. Stable enough to treat as the operating regime, not a curiosity.
What "battery problem" means here
Batteries did not fail. The question changed.
The old duck question was whether evening net load would crash the system when solar drops. The useful question now is how much the fleet can absorb at noon, how hard it can discharge at 8pm, and why solar is still getting thrown away on hours when that fleet is already charging.
Curtailment on a high-charge hour is the tell. Storage is large enough to reshape the day. It is still not large enough, or flexible enough, or located right enough, to eat every surplus megawatt-hour. The duck is managed as a charge and discharge schedule. The leftover dump is the residual.
What this number can and cannot claim
Can claim: on 2026-08-04, CAISO's published fuelsource.csv Batteries series showed a mid-morning charge peak near 8.9 GW (hour 9 Pacific) and an evening discharge peak near 10.4 GW (hour 20). Hourly curtailment from CAISO's daily renewable report for that day totaled about 7.8 GWh. Several midday hours show both charging and curtailment at once.
Cannot claim: state of charge; plant-level BESS telemetry; that batteries caused or failed to prevent curtailment; that every curtailed MWh could have been stored; or that ERCOT or PJM match this pattern. This essay is CAISO outlook plus CAISO curtailment only.
The Batteries column is a fleet-net signal from the public outlook, not a meter on every project. Co-timing is measured. Calling the duck a storage-dispatch problem is our read of that co-timing.
How to use it
- Midday curtailment is not proof that California has no storage. Check the charge series on the same hours.
- Evening reliability is a discharge-capacity and duration question, not only a solar-drop question.
- When someone shows a duck-curve cartoon from 2015, ask for the same-day battery charge and discharge overlay.
- Surplus that appears while the fleet is already charging is the residual storage gap.
Open the data
- Curtailment Tracker: CAISO daily solar and wind curtailment
- LMP Dashboard: CAISO fuel mix and battery charge/discharge panel
- Grid Demand: live CAISO load for the evening ramp
- Primary sources: CAISO fuelsource history, daily renewable report
- API:
GET /curtailment/hourly?iso=CAISOandGET /generation/battery?iso=CAISOon data.kardashevlabs.org
Method: Case day 2026-08-04 Pacific from CAISO primary files. Battery: historical fuelsource.csv Batteries column (negative = charging, positive = discharging); peaks are max hourly mean of 5-minute fleet MW. Curtailment: daily renewable report HTML hourly arrays. Peak charge 8.9 GW at hour 9. Peak discharge 10.4 GW at hour 20. Day curtailment 7.8 GWh (7.80 GWh solar, 0.03 GWh wind). Week battery pattern checked on CAISO fuelsource history for Aug 1 to 6, 2026.