The ERCOT large-load queue was climbing before 2026.
Requested Large-Load capacity sat near 35–57 GW for years, then climbed through 2025 and hit 466.5 GW by June 2026. Observed Energized MW is still basically the x-axis.
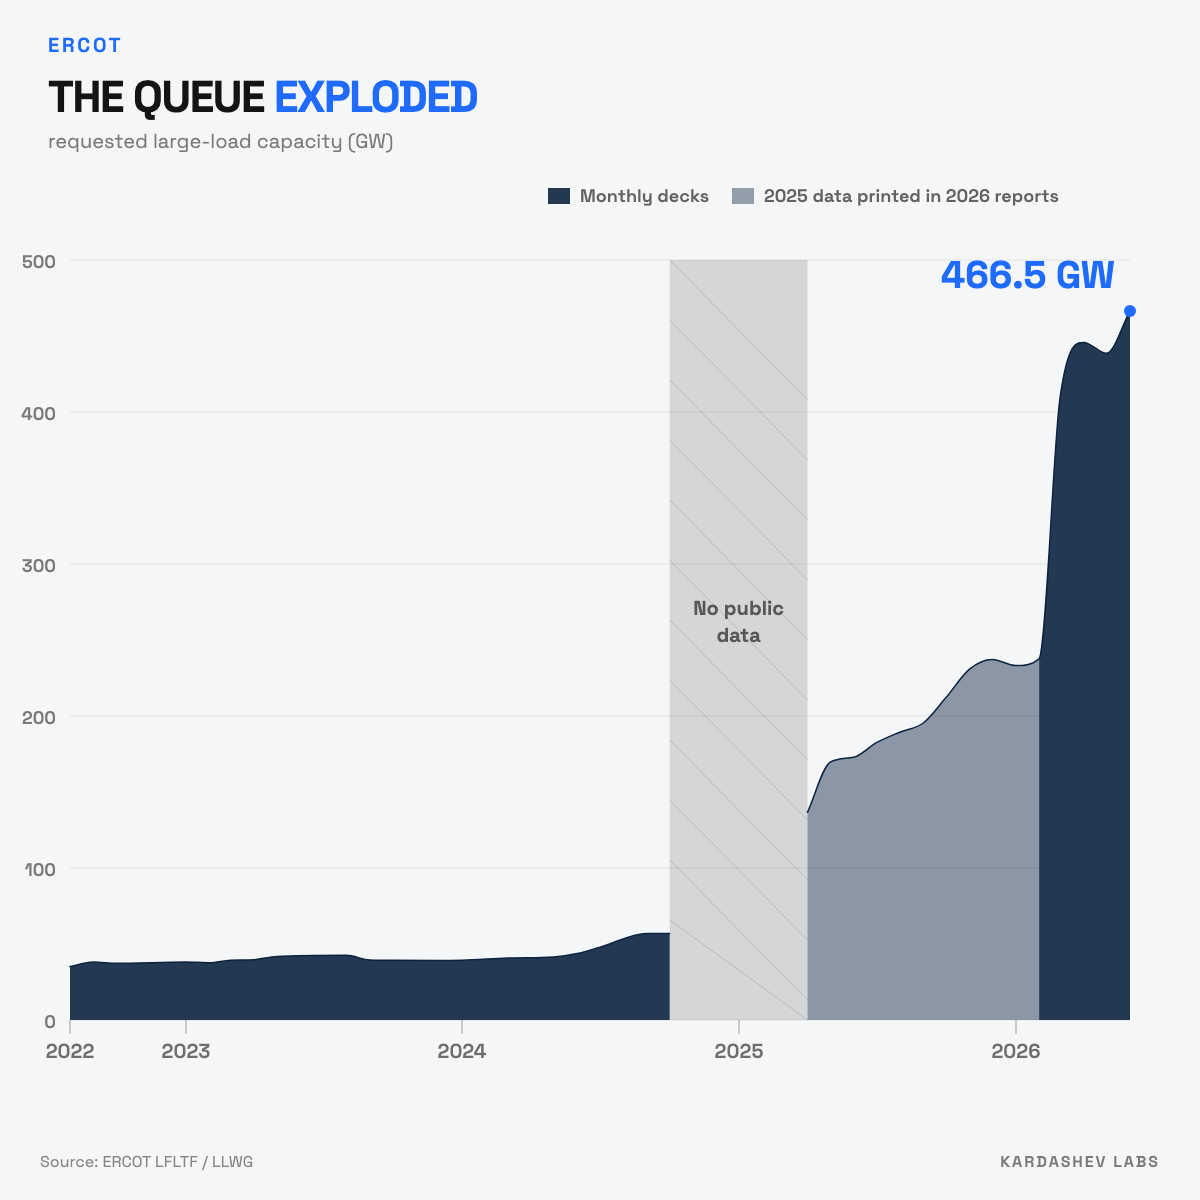
The ERCOT large-load queue was climbing before the 2026 headlines. The decks show it.
Data-center and industrial load requests get compressed into a single headline number. That number is almost always the latest deck total. The public LFLTF and LLWG status decks tell a longer story: years of relative flatness, a gap with no standalone monthly totals, a 2025 climb that only appears inside later reports' trailing charts, then a 2026 primary series that ends at 466.5 GW.
Observed Energized MW is still basically the x-axis.
Read the decks as a publication history
ERCOT does not ship a clean daily API for large-load queue totals. The usable public record is the monthly committee decks: Large Flexible Load Task Force (LFLTF) and Large Load Working Group (LLWG). We extracted requested-capacity totals from 23 primary decks, then filled the 2025 gap with trailing-12-month totals printed inside later 2026 decks.
Two series on one chart:
- Monthly decks (solid): totals published in that month's primary status deck
- 2025 data printed in 2026 reports (lighter fill): trailing-12-month figures that only appear when later decks look backward
Do not interpolate the months with no public total. Oct 2024 through Mar 2025 have no standalone monthly number in this series. The chart leaves that gap blank on purpose.
What the film shows
| Period | Requested large-load capacity |
|---|---|
| Aug 2022 → Sep 2024 (primary decks) | ~35 → ~57 GW |
| Oct 2024 → Mar 2025 | No public monthly total |
| Apr → Dec 2025 (trailing charts in 2026 decks) | ~137 → ~237 GW |
| Feb 2026 primary | ~238 GW |
| Jun 2026 primary | 466.5 GW |
| Observed energized (Jun 2026) | 5.7 GW |
For years the queue sat in a band that fit on a chart under 100 GW. Through 2025 the trailing totals already show a steep climb. By mid-2026 the primary deck prints 466.5 GW of requested capacity. Observed Energized MW in the same window is 5.7 GW.
Queue megawatts are interest. Energized megawatts are the operating fact.
What this number can and cannot claim
Can claim: from public LFLTF/LLWG decks, requested large-load capacity rose from a multi-year ~35–57 GW band to 466.5 GW by June 2026, with a documented climb through 2025 visible in trailing charts, while observed energized capacity remained on the order of single-digit GW.
Cannot claim: that 466.5 GW will interconnect; that every request is a data center; that the Oct 2024–Mar 2025 gap can be filled by linear interpolation; that trailing-12-month figures are identical to a missing primary monthly series; or that generation-queue GW and large-load GW are the same process. A generation interconnection row asks to inject power. A large-load request asks to take it.
How to use it
- Treat the latest deck total as a snapshot of interest, not a build forecast.
- Keep the 2025 climb in view so 2026 does not look like a single discontinuity.
- Leave the no-data months blank rather than inventing a path through them.
- Pair requested GW with energized GW before arguing about near-term grid stress from this queue alone.
Open the data
- Large Load Tracker: ERCOT large-load queue history from LFLTF/LLWG decks, zone scorecards, Batch Zero context
- Site Clearance: county-level ERCOT estimate from GIS queue pressure, peer timelines, and LMP stress
- Interconnection Queue Tracker: generation and storage queues across all 7 US ISO/RTOs
- Interconnection timelines: measured screening-to-energization by zone and fuel
Method: Kardashev Labs extraction from public ERCOT LFLTF/LLWG status decks (GET /ercot/large-load/history). Primary monthly totals plus trailing-12-month figures printed inside later decks. Gap Oct 2024–Mar 2025 left blank. Observed energized as of June 2026: 5.7 GW.