ERCOT Full Process is not one number.
People quote one ERCOT interconnection timeline like it applies everywhere. Measured Full Process from 97 months of GIS Film shows CDR Zone and fuel gaps of nearly a year.
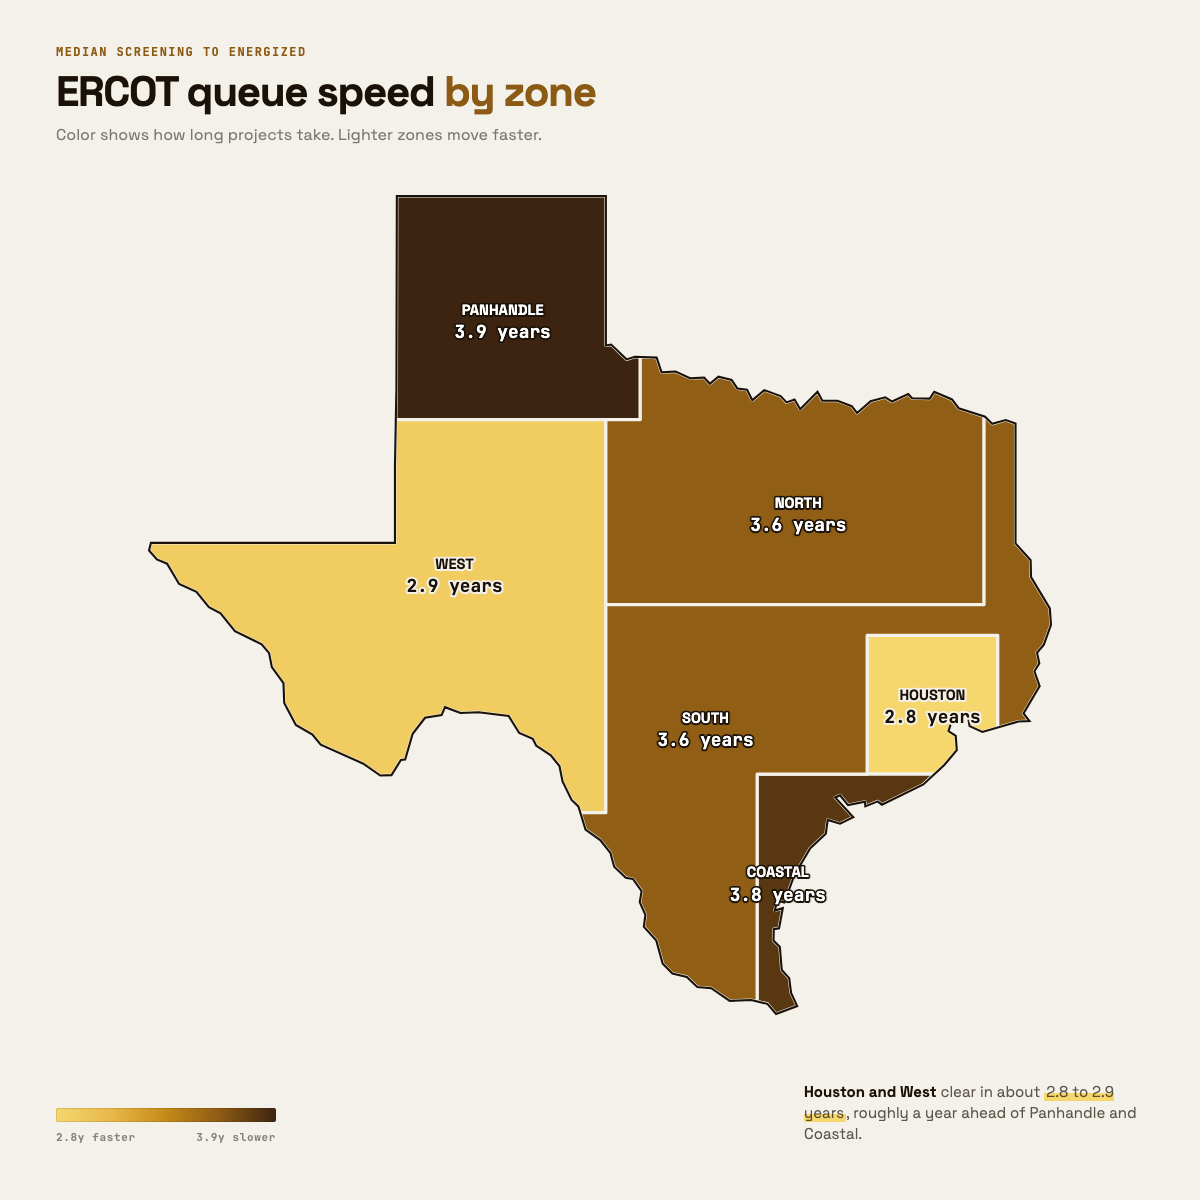
People quote one ERCOT interconnection timeline like it applies everywhere. It doesn't.
Developers, consultants, and capital partners still trade in single figures: "three years," "four years," whatever the last conference slide said. The public GIS Report makes a better claim available: follow each project's milestone dates across monthly publications and measure how long screening-to-energization actually took, by zone and by fuel.
Read milestones as a film, not a status badge
Status fields answer "where is this project today?" Timeline questions need history. We ingested every ERCOT GIS Report from December 2018 through June 2026 (97 monthly filings) and tracked 3,152 projects' milestone dates over time, not just their current row.
The interval that matters for site selection is screening study to approved-for-energization. That is the measured path from early study into a state where the project can actually energize. Filed commercial operation dates (COD) are a different field: useful as a filing claim, unreliable as a delivery forecast.
Zone medians diverge by almost a year
Median Full Process, by ERCOT CDR Zone:
| Zone | Median years |
|---|---|
| Houston | ~2.8–2.9 |
| West | ~2.8–2.9 |
| North | ~3.6–3.9 |
| South | ~3.6–3.9 |
| Coastal | ~3.6–3.9 |
| Panhandle | ~3.6–3.9 |
Same market. Nearly a year of difference between the faster CDR Zones and the slower ones. If you are picking Footprints on schedule, not just $/MWh, CDR Zone is not a footnote.
Fuel splits the same film
Across the same history:
- Gas: ~2.6 years median
- Solar: ~3.9 years median
A working guess (not proven yet) is that gas projects are fewer and often land on sites ERCOT has already studied, while solar piles into the same substations and waits. That needs a queue-volume-by-zone check before it becomes a claim. The measured gap is real either way; the causal story is still open.
Slippage stacks on top of the median
Filed COD versus actual energization runs late. Median slippage in this film is roughly 3–10 months, worse in South and Panhandle than in West. If a filing in those slower zones says COD 2027, plan 2027 plus 6–12 months, not the printed date.
Right now thousands of projects remain in process and not energized (on the order of 588 GW of requested capacity, roughly 6x ERCOT peak demand). Most of that will not get built. Measured zone and fuel history is a better filter than the COD on the form. For the separate large-load request stack, see the ERCOT large-load queue explosion.
What this number can and cannot claim
Can claim: among projects that reached energization in this GIS film, median screening-to-energize times differ by roughly a year across zones, and gas has been faster than solar on the same metric.
Cannot claim: that a new project in West Texas will finish in 2.8 years; that CAISO or PJM timelines match these numbers; that COD fields are forecasts; or that the gas/solar gap is fully explained by substation congestion (that remains a hypothesis).
CAISO, for comparison, does not publish an ERCOT-style monthly milestone film with the same reconstruction path. Asking for a "California version" of this chart hits a data boundary, not a tooling one.
How to use it
- Pick the zone before you trust a market-wide timeline slide.
- Treat filed COD as a claim; add measured slippage for that zone.
- Pair timeline medians with survival rates so queue depth does not masquerade as a build list.
- For a county-level first pass inside ERCOT, run the same GIS pressure and peer-timeline inputs through Site Clearance.
Open the data
- Interconnection timelines: interactive zone and fuel cuts from this film
- Site Clearance: draw a search area; get a county-level strong / mixed / weak estimate
- Interconnection Queue Tracker: live search across all 7 US ISO/RTO queues
- Large Load Tracker: ERCOT large-load queue history from LLWG/LFLTF decks
Method: Kardashev Labs analysis of ERCOT GIS Report monthly snapshots (Dec 2018–Jun 2026), milestone dates tracked across publications.