Where can a 500 MW load get power in ERCOT?
Five Texas footprints run through Site Clearance at 500 MW large load: gen queue, zone peer timelines, LMP stress, HIFLD density, GridSFM DC screen. Public data. Not an ERCOT study.
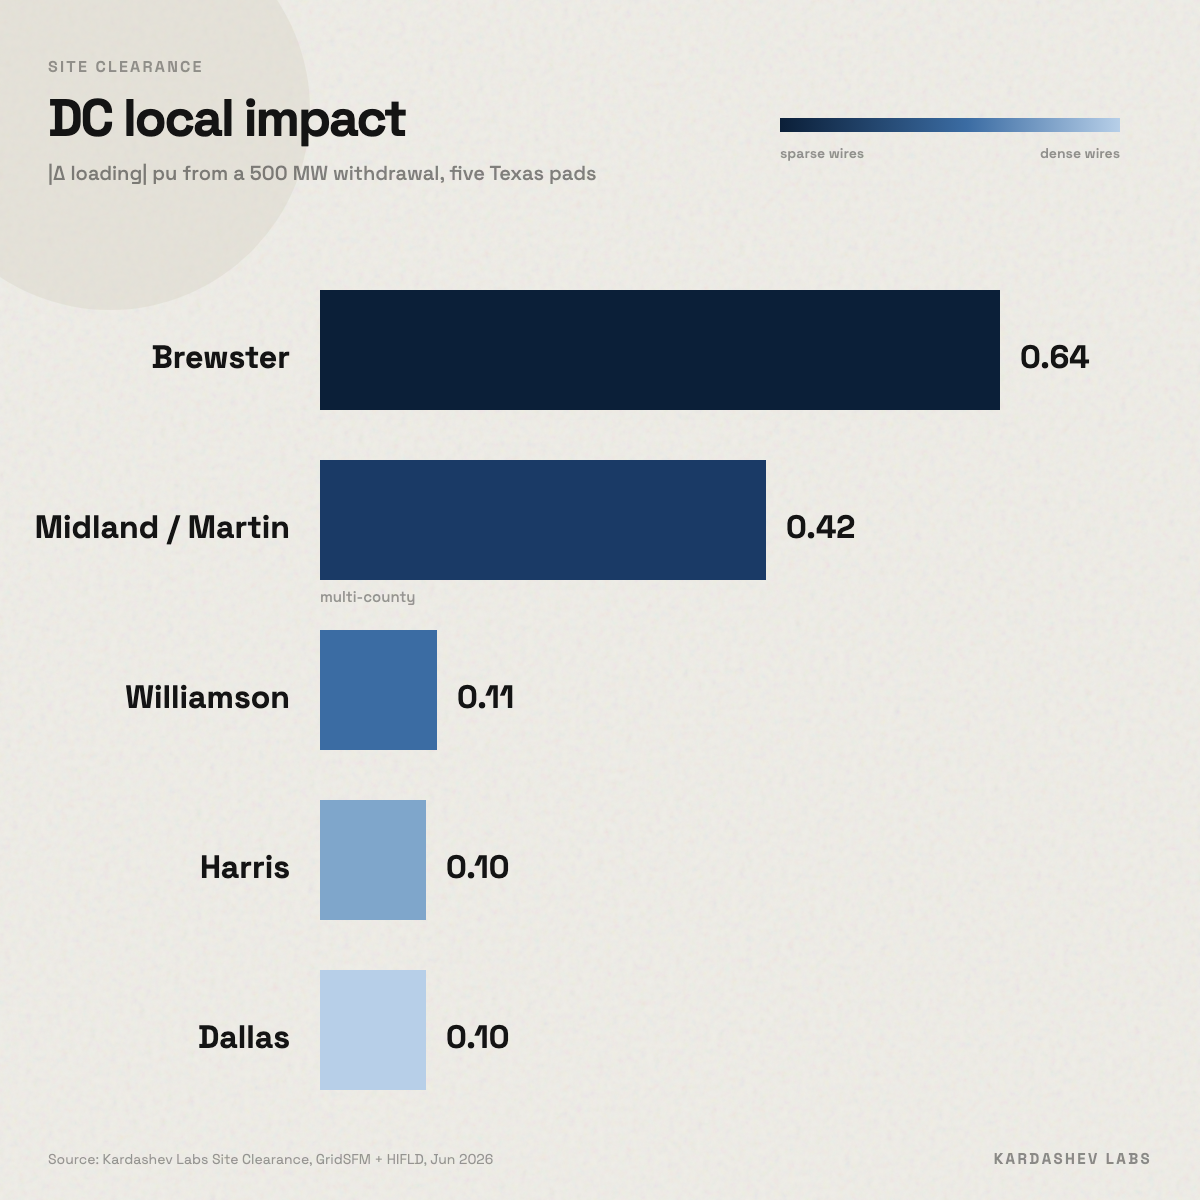
I wanted a concrete answer to a boring question: for a handful of Texas land pads, which ones look less bad on public grid data if you assume a 500 MW large load?
So I ran Site Clearance on five footprints. Same MW, same large-load mode, same pipeline. County resolution. Not an interconnection study.
Four pads are single-county boxes. One (Midland / Martin) sits on a county line on purpose, because real search areas often do. The tool scores every county covering at least 5% of the polygon.
Large-load mode still will not spit out a trustworthy firm grade. ERCOT does not publish project-level load-queue pins. This post compares the signals side by side instead of pretending there is a winner ribbon.
What went into each screen
For each footprint the tool pulls:
- Pending generation GIS MW in the scored counties (other projects asking the same neighborhood for wire attention; this is not the large-load queue)
- Peer screening-to-energization medians for the CDR zone those counties map to
- Trailing negative RT price hours on the mapped load zone
- HIFLD transmission-line density vs the Texas median
- A DC power-flow screen on the GridSFM Texas model: 500 MW withdrawal, local branches only
The wire and DC blocks are proxies. They do not move any grade. Details: methodology.
Five footprints
| Footprint | Counties in score | CDR zone | Gen pending | Peer median | Neg. price hrs | HIFLD vs TX median | DC local |Δ| @ 500 MW |
|---|---|---|---|---|---|---|---|
| Harris | Harris 100% | HOUSTON | 6,659 MW | 2.8 yr | 1.6% | 5.1× (dense) | 0.10 |
| Midland / Martin | Midland 51%, Martin 49% | WEST | 1,328 MW | 2.9 yr | 10.5% | 1.5× (dense) | 0.42 |
| Williamson | Williamson 100% | SOUTH | 449 MW | 3.6 yr | 2.3% | 1.3× (typical) | 0.11 |
| Dallas | Dallas 100% | NORTH | 867 MW | 3.6 yr | 3.1% | 5.6× (dense) | 0.10 |
| Brewster | Brewster 100% | WEST | 229 MW | 2.9 yr | 10.5% | 0.11× (sparse) | 0.64 |
Each link opens the same pad I scored (a drawn box, not a surveyed parcel):
- Harris, 500 MW load
- Midland / Martin, 500 MW load
- Williamson, 500 MW load
- Dallas, 500 MW load
- Brewster, 500 MW load
Notes from the table
Harris lands in HOUSTON. Generation peer median there is 2.8 years, the shortest of the five. That clock is generation interconnection history. It is not how long a large load will take to energize. I still treat it as a useful process-speed prior for that pocket of the ISO.
Midland / Martin is the multi-county pad: almost a 50/50 split on the Permian county line. Crossing that line changes the score because GIS pending MW and wire proxies are county-attributed. Pending gen in the scored set is 1,328 MW, and the DC local |Δ| is 0.42. A Midland-only box on the same pipeline landed closer to 0.19.
Brewster and the Midland / Martin pad both map to WEST (~2.9 yr peers) and about 10.5% negative RT hours on the west load zone.
Brewster is still the sparse end of the set. HIFLD density is about 0.11× the Texas median. On a 500 MW withdrawal, the DC screen's local impact hits 0.64 pu. Harris and Dallas sit near 0.10.
Dallas (NORTH) and Williamson (SOUTH) are the quiet pair: 3.6 yr peers, calmer markets than West, HIFLD typical-to-dense. No red flag. No speed story either.
One more trap: Harris shows thousands of MW of pending generation in-county. That does not mean a load cannot connect. It means other projects are already in line for the same general part of the grid.
What this can and cannot claim
Can claim: on these five public screens, HOUSTON has the shortest generation peer median; WEST has elevated negative-price hours; Brewster's sparse public transmission layer and DC local impact stand out under a 500 MW withdrawal; the Midland / Martin split changes the pending-MW and wire rollups versus a single-county box; each row is reproducible from the share links above.
Cannot claim: which site clears an ERCOT large-load study; available MW at a POI; N-1 security; that GridSFM is ERCOT's planning model; that HIFLD densities are thermal ratings; that large-load wait times equal generation peer years.
Background on why the load queue is the loud topic: the ERCOT large-load queue was climbing before 2026. Generation zone/fuel clocks: measured interconnection timelines.
Run another pad
Open Site Clearance, draw Texas, set Large load / 500 MW, read queue + timelines + market + the wire appendix, copy the link if you want a second pair of eyes on the same polygon.
Also useful: Large Load Tracker, Interconnection timelines, LMP map.
Method: Site Clearance POST /clearance/score on 2026-08-02 against the June 2026 GIS snapshot, zone peer tables, ercot_zone_stats, HIFLD density proxy, and GridSFM Texas DC scenarios. Four single-county boxes plus one Midland / Martin boundary pad. Numbers move when the underlying month updates.